Vol. 1, No. 3, Published July 6, 2015
Latest News: Summary of Ratings, Borrowing Costs, Debt Issuance, Investments and Treasury Activities
Improving Our Stewardship of Public Money Helps Us All In The Long Run

By exemplifying good financial habits, the State of California can make consistent, incremental progress toward reducing bond borrowing costs, therefore saving taxpayers millions of dollars over time in the process.
If the State reduces borrowing costs, we�ll have more freedom to pay for other essential things, such as education, public safety, infrastructure and social services.
Seeking to improve the State�s bond ratings � which currently sit at Aa3 from Moody�s Investors Service, AA- from Standard & Poor�s Ratings Services (S&P) and A+ from Fitch Ratings -- is key as we seek to cut borrowing costs. Despite S&P�s recent upgrade, Fitch still has California below a �high-grade� designation. Moreover, there is still significant headroom for future improvement.
Consider this hypothetical example: On a $1 billion borrowing for essential infrastructure, California would currently pay $24 million more over a 20-year period than it would if it were rated at AAA.1
That $24 million represents a lost opportunity.
For example, if you placed $24 million in dollar bills end to end, they would stretch along California�s Interstate 5 from the California-Mexico border to the California-Oregon border �nearly three times!2
Also, $24 million equals the cost of 89 Cal Fire wildland fire engines3, a year�s worth of salaries for 267 California Highway Patrol officers4, or nearly 2,000 grants for low-income California college students5.

How can the State make incremental progress in improving our ratings? Basically, we need to prove to ratings agencies that we�re good stewards of the public�s money.
To understand where rating agencies are coming from, it helps to look at three key things they analyze when evaluating debt issued by the State of California:
- the state of the State’s economy,
- financial results that the State has achieved,
- and how the State manages and responds to changing circumstances.
We�ll discuss all three of these areas in the coming months, but let�s first focus on how rating agencies look at our economy.
Let�s remember that if California were a separate nation, it would be among the top 10 economies in the world. We�re highly dependent upon the economic activities in financial services, technology, trade and transportation.
Fitch Ratings recently noted that California�s economy is unmatched among U.S. states in its size and diversity.
S&P takes a similar view, citing California�s prominent higher education institutions and its broad range of businesses in cutting-edge sectors. S&P also notes that California�s economy positions it as the leading recipient of venture capital in America.
On the other hand, credit rating agencies often cite California�s volatile revenue sources and its initiative process as being rating negatives. That�s because revenues are more susceptible to adverse change than the expenditures they support. The initiative process is viewed by many rating agencies as ballot box budgeting that ties the hands of the Governor and Legislature, thereby providing less flexibility to deal with change.
While it�s difficult to manage a cyclical economy shaped by many factors, it�s important to realize that it is changing all of the time, and the State must be flexible in anticipation of these changes.
A large number of global factors impact California, including changes in economic growth rates abroad, exchange rates, commodity prices, investment flows, demographic shifts and environmental forces. (Read more in Connecting the Dots.)
Despite these outside factors, we should always ask ourselves a key question: How can we take better charge of our own future? When it comes to being proactive or reactive, effective managers are always proactive.
The November 2014 passage of Prop. 2, which improved the State�s rainy day fund, is a good example of multi-year flexibility and will help improve California�s credit rating over time.
After much hard work and improved financial performance, the State ratings have improved in recent years. You can track our progress here. However, we’re not done. We need to do more today so that in the future we can hold on to the gains we’ve worked so hard to achieve.
In the August edition, we�ll take a closer look at the gains we've already achieved, while in September we�ll discuss management practices we can adopt to help us improve our bond rating.
1 This is an estimate since California doesn�t enjoy the higher, AAA rating. However, an abundance of market data supports the view that the borrowing cost differentials are both real and significant.
2 Interstate 5 runs 796.5 miles north from the California-Mexico Border to the California-Oregon border. Interstate 5 runs 796.5 miles north from the California-Mexico Border to the California-Oregon border. Since one dollar bill is 6.125 inches long, 1 million dollar bills equals 6,125,000 inches, or 510,416.6666 feet, or 96.669 miles. Then, 96.669 miles x 24 = 2320.1 miles. Last, 2320.1 divided by 796.5 equals 2.9.
3 The cost of the pictured Cal Fire fire engine is $268,000. Photo courtesy of Cal Fire.
4 Figure based on average 2013 wages of $89,825 for California Highway Patrol staff, as reported by the State Controller’s Office .
5 Figure is from the Cal Grants website and is derived by dividing $24 million by the maximum annual Cal Grant of $12,192 for a total of 1,968.
Where Does California Fit In?
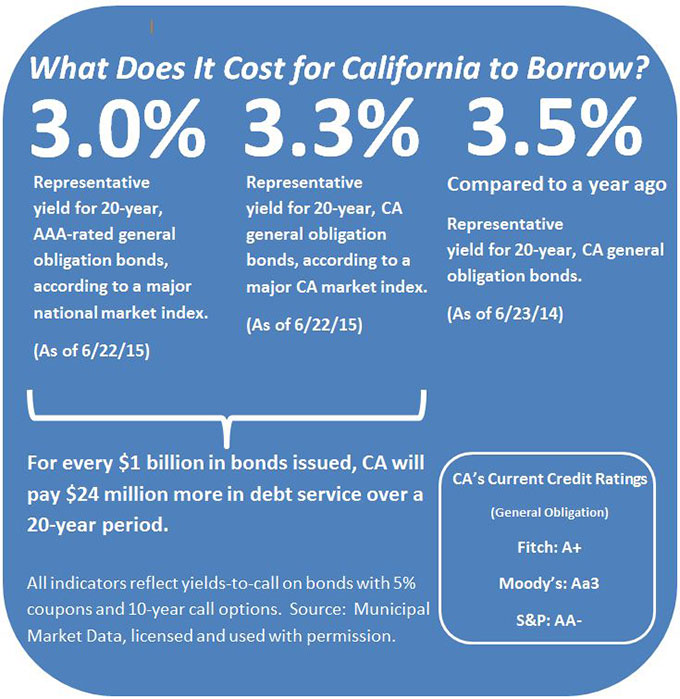
Until very recently, California’s bond ratings were lower than all but two rated states. Even with recent improvements, holding the higher rating levels over time is what matters most. Lower ratings provoke investors to demand higher yields, which translates into higher borrowing costs.
The State�s recent 20-year yield sat at 3.32 percent, higher than the 3.02 percent yield on a national index of AAA-rated bonds, a difference of 0.3 percent. (See Figure 1.)
Compared to the prior month, the nominal yield on the California index dropped by 0.07 percent, while the nominal yield on the national index dipped by 0.04 percent.
The difference between the two indices one year earlier was slightly wider: California�s yield was 3.52 percent, while that same national index was at 3.13 percent, a difference of 0.39 percent.
There are multiple explanations of this phenomenon. First, the narrowing of the index was likely the market’s anticipation of an imminent change in California’s rating, which in fact occurred on July 2 when S&P announced that the State’s general obligation rating has been taken up to AA-, and its annual apportion debt rating has been raised to A+.
Second, because California concentrates most of its borrowing in the spring and in the fall of each year, there is likely to be some scarcity value reflected in the spreads. In other words, when there are fewer bonds, the prices tend to rise, remembering that prices and yields move inversely.
Figure 1: Borrowing Costs
What does California�s higher investment yield mean for taxpayers?
In general, for every $1 billion in bonds issued, the State will have to offer investment yields that will incur nearly $24 million higher debt service amounts over a 20-year period compared to the national index of AAA-rated, tax-exempt bonds. (See Figure 2.)
Of course this is hypothetical, but the projected lower debt service amounts indicate that there would be a nearly $20 million reduction in costs to California taxpayers when compared to three months ago. Though these savings are expressed only as an illustrated outcome, the effect is very real. Lower yields equal lower borrowing costs and higher ratings produce lower yields. Therefore, reasonable steps taken by the State�s management that result in improvement to California�s ratings have positive outcomes for California taxpayers when compared to other issuers with higher ratings. Figure 2 graphically represents this phenomenon.
Figure 2: Comparing California's Borrowing Costs to a National Index
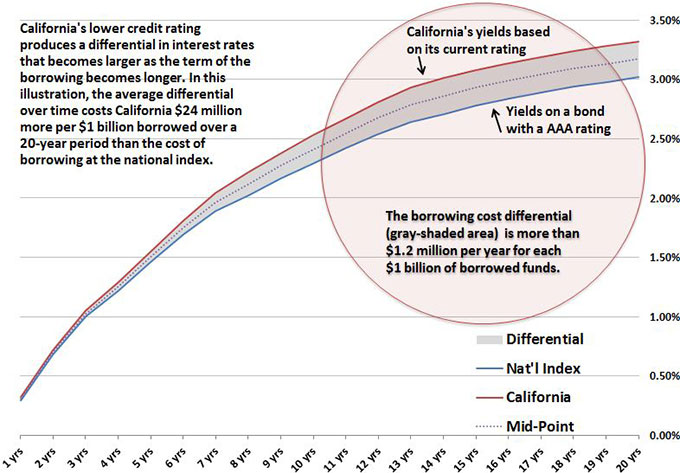
Source: Municipal Market Data as of 6/22/15
When it comes to understanding investment yields and borrowing costs, it helps to look at long-term trends.
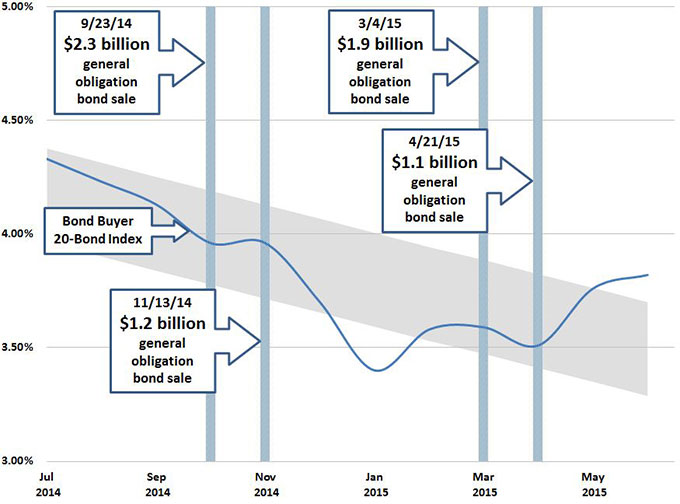
Figure 3, below, shows the one-year trend in another widely used index, the Bond Buyer 20-Bond Index, over the past year. California�s most recent offerings are shown as vertical bars.
The Bond Buyer 20-Bond Index has begun to rise in recent weeks. There are several possible explanations for this, including:
- the increasing likelihood of the Federal Reserve System raising interest rates,
- recent press reports of fiscal stress in the City of Chicago, and
- recent turmoil in the markets over Puerto Rico’s fiscal challenges.
These events have resulted in outflows from mutual funds invested in municipal bonds. In times of market uncertainty, fixed-income investors tend to gravitate toward securities in the so-called safe sector, notably U.S. treasuries.
Figure 3: One-Year Trend of Interest Rates, Selected California Borrowings Shown as Vertical Bars
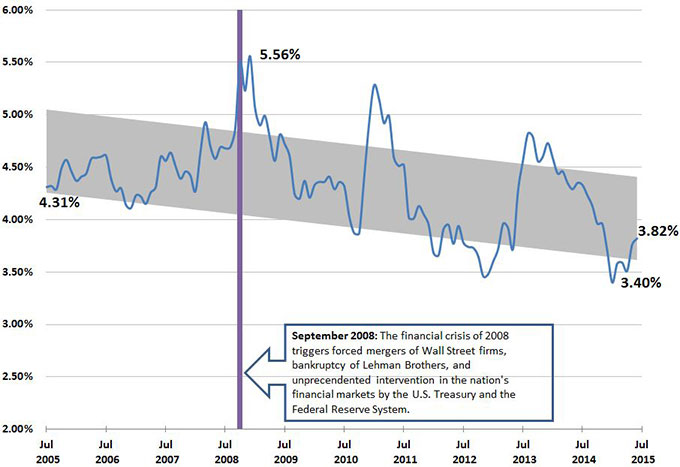
Interest rates on State and local government bonds are lower than they were a decade ago. Figure 4 also uses the Bond Buyer 20-Bond Index, but over a longer 10-year period.
This figure also reflects the trend shown in Figure 3, but less dramatically. Nevertheless, it is clear that we may be at the beginning of a turnaround toward higher interest rates.
Figure 4: 10-Year Trend of Interest Rates on State and Local Government Bonds
Debt Issuance
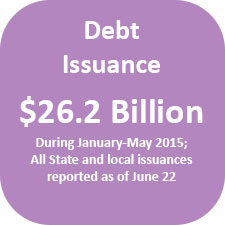
California State and local governments issued a total of $26.2 billion in debt during the first five months of 2015, a 31 percent increase from the same period in 2014, when $20 billion in debt was issued, according to data received by the California Debt and Investment Advisory Commission (CDIAC) as of June 22.6 (See Figure 5.)
As the economy improves and as the probability of rising interest rates comes closer, it is highly likely that State and local governments are accelerating their borrowing to acquire or replace infrastructure assets used to deliver services to the public.
A total of $3.1 billion in State and local debt issuance was reported for May 2015, a 19 percent decrease from May 2014 ($3.7 billion). (See Figure 6.) A considerable part of this decrease may simply be seasonal.
Of the $3.1 billion issued, $2.945 billion was issued by local entities, while $174 million was issued by the State and its agencies or related entities. (See Figure 7.)
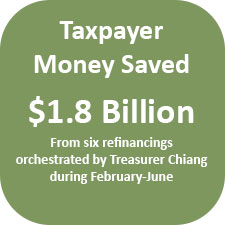
So far in 2015, the Treasurer has carried out six different refinancings that will together save taxpayers more than $1.8 billion over the life of the bonds. It is possible that the State may continue these refinancing activities in the fall of 2015, assuming the interest rate environment is hospitable.
For the period from May 16 through June 15, a total of $3.6 billion in debt final sale reports were received by CDIAC. (See Figure 8.)These are the top five areas of volume within the reported final debt sales:
- K-12 School Facility: $1.6 billion
- Health Care Facilities: $389 million
- Public Building: $380 million
- College, University Facility: $312 million
- Water Supply, Storage, Distribution: $287 million
The improving economy appears to be making local K-12 school districts more confident in proceeding with capital development plans.
6 Issuers have 21 days from sale of the debt to report issuances. Since some data is reported late, the Treasurer's Office regularly updates monthly totals as more information becomes available.
Figure 5: Cumulative California Public Debt Issuance (In Billions)
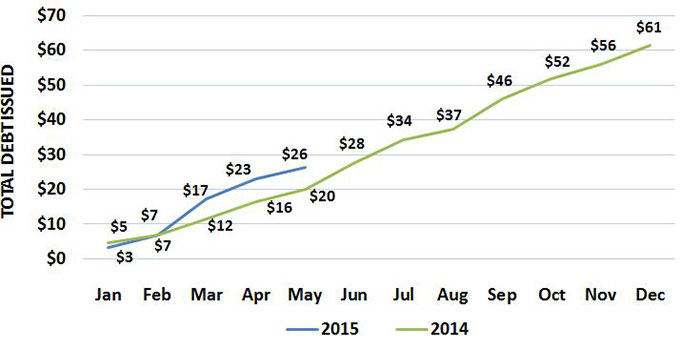
Source: California Debt and Investment Advisory Commission
Figure 6: California Public Debt Issuance, May (In Millions)
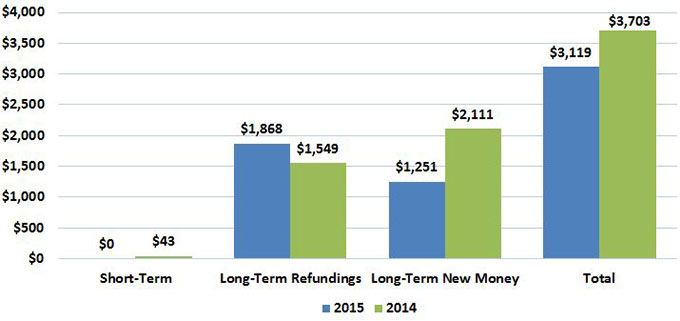
Source: California Debt and Investment Advisory Commission
Figure 7: State* Vs. Local Debt Issuance, May (In Millions)
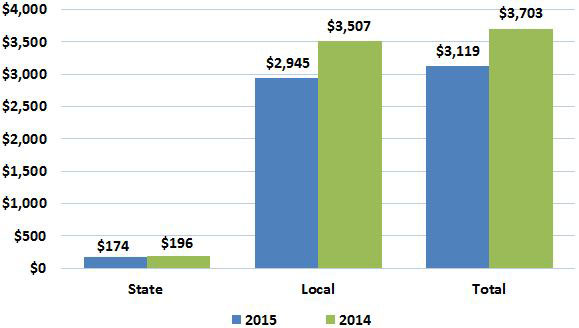
* State issuers include the State of California, its agencies, commissions, authorities, departments and The Student Loan Corporation.
Source: California Debt and Investment Advisory Commission
Figure 8: Total Reports of Final Sale Received
5/16/2015 Through 6/15/2015, By Purpose (In Millions)
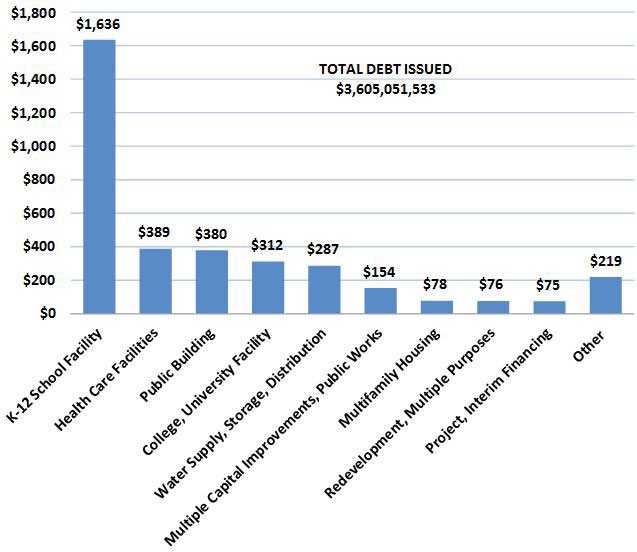
Source: California Debt and Investment Advisory Commission
Read more about debt issued so far this year. See the calendar.
Investments
The Treasurer�s Investments Division manages the State�s excess or idle cash.
The Treasurer invests taxpayer money through the Pooled Money Investment Account (PMIA). This is a comingled pool with three primary sources of funds: the State�s general fund, special funds held by State agencies, and money deposited by cities, counties and special districts in the Local Agency Investment Fund (LAIF).
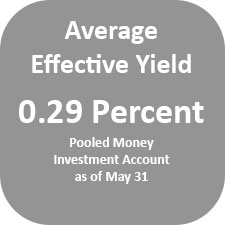
As of May 31, the PMIA balance was $66.5 billion, with an average effective yield of 0.29 percent and an average life of 222 days. (See Figure 9.) The average daily PMIA balance was $58.3 billion for the fiscal year as of May 31.
The Treasurer�s Office anticipates that the investment returns for the PMIA will continue to follow the market as shown in Figure 10.
Because these funds may be required on very short notice, the investment objectives for the Pooled Money Investment Account are safety, liquidity and yield, in that order of importance.
The year-to-date earnings rate for the PMIA is 0.266 percent, which reflects the prudent investing of a short-term portfolio in this unprecedented low interest rate environment of the last seven years. As the Federal Reserve begins to raise interest rates, the PMIA is positioned to follow those moves.
Figure 9: Pooled Money Investment Account Stats as of May 31, 2015
Ending Portfolio
$66.5 billion (See Figure 11 for details.)
Average Workday Investment Activity
$1.163 billion
Average Effective Yield
0.29 percent
Average Investment Life
222 days
Local Agency Investment Fund Ending Portfolio
$21.6 billion (2,494 participating agencies) (See Figure 12 for details.)
Read more about the Pooled Money Investment Account
Figure 10: Average Monthly Yield Comparison
May 2010 Through May 2015
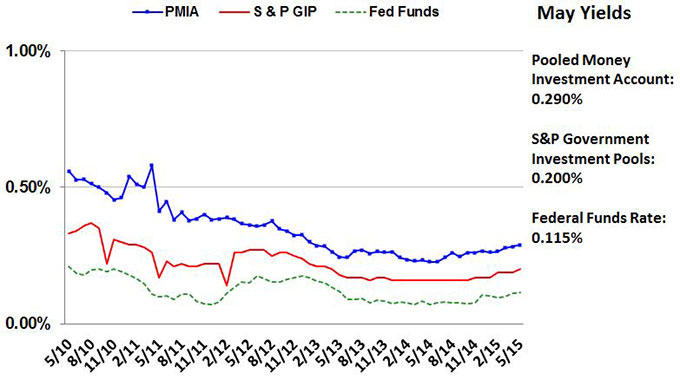
Source: State Treasurer's Office
Figure 11: PMIA Portfolio Composition – 5/31/15
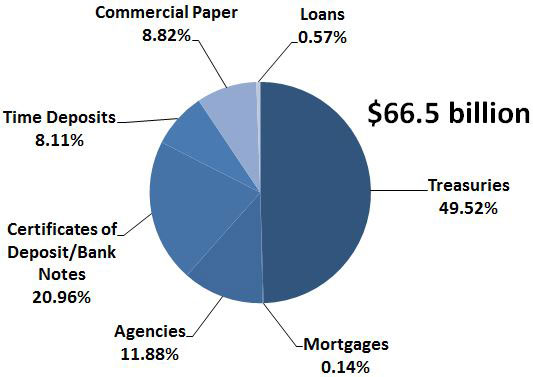
Source: State Treasurer's Office
Figure 12: Local Agency Investment Fund
Participation as of 5/31/15: 2,494 Agencies
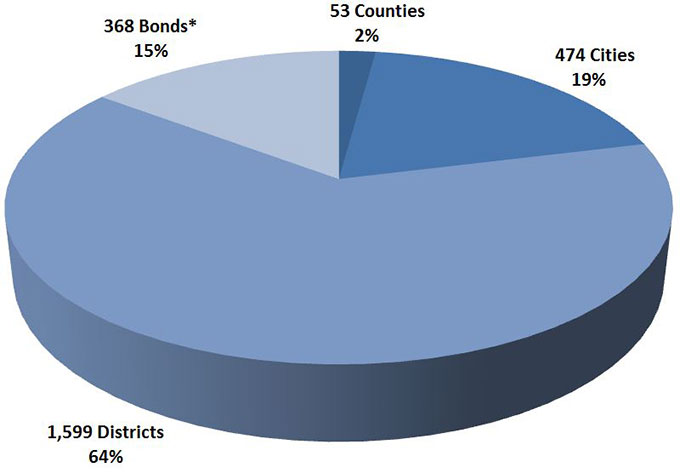
Source: State Treasurer's Office
*Includes regular and trustee bond accounts.
Read more about the Local Agency Investment Fund.
Centralized State Treasury System Activities
The Treasurer�s Centralized State Treasury System provides banking services for the overwhelming majority of State departments and agencies.
The system handles the flow of more than $2 trillion per year in cash funds.
During May, deposits totaled $83.1 billion, while disbursements totaled $83.5 billion. (See Figure 13.)
These amounts include all federal, State and local funds flowing through the Centralized Treasury System.
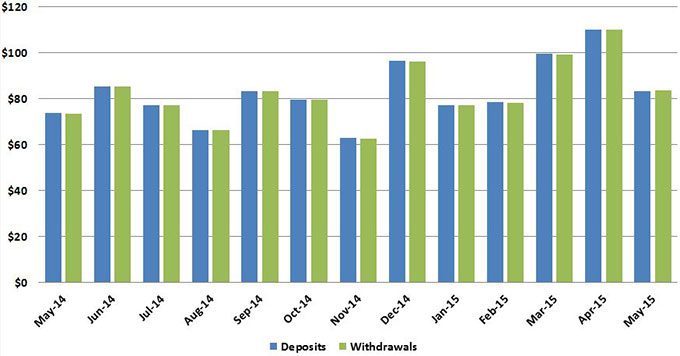
Figure 13: Deposits and Withdrawals By Month, May 2014-May 2015 (In Billions)
The system also determines the amount of idle State funds available in the Pooled Money Investment Account for investment by the Treasurer�s Investment Division. (These investments were discussed in the Investments section and are reflected in Figure 11.)
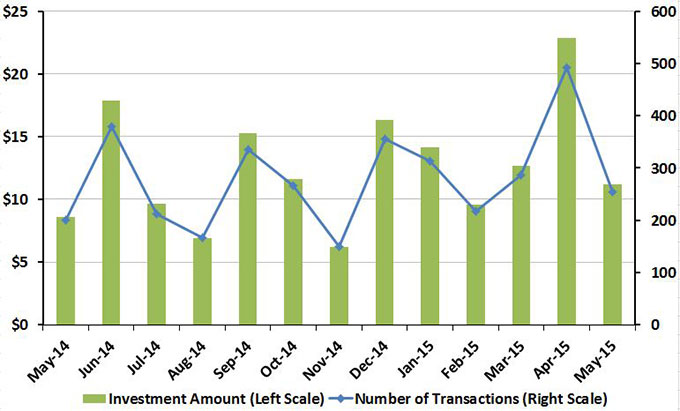
During May, total new and rollover investments reached $11.2 billion. (See Figure 14.)
Figure 14: Total Investments By Month, May 2014-May 2015 (In Billions)
Source: State Treasurer's Office
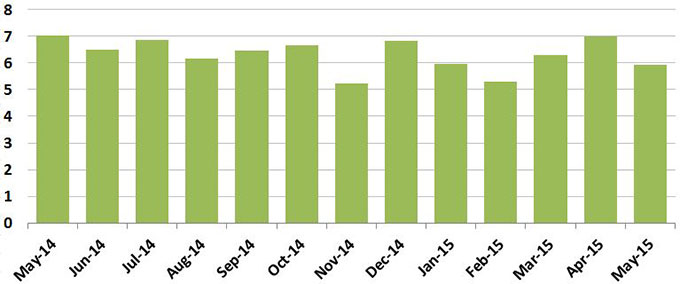
Each day, the system also processes hundreds of thousands of State transactions -- including department checks, State Controller�s Office warrants, Women Infant Children (WIC) food instruments, Employment Development Department unemployment and disability checks - submitted by banks and other entities for payment.
During May, total items processed reached 5.9 million. (See Figure 15.)
Figure 15: Number of Items Processed, May 2014-May 2015 (In Millions)
Source: State Treasurer's Office