Subscribe to Intersections 
VOL. 2, NO. 6
Published June 14, 2016
IN THIS EDITION:
Investing in Tobacco Companies is Harmful to Health, State's Bottom Line
Head to Head: Minimum Wage Increase


California Job Tracker
Millennials’ Impact on the Current Housing Market Recovery: Short-Term Phenomenon or Long-Term Structural Shift?

California Job Tracker
By Lynn Reaser
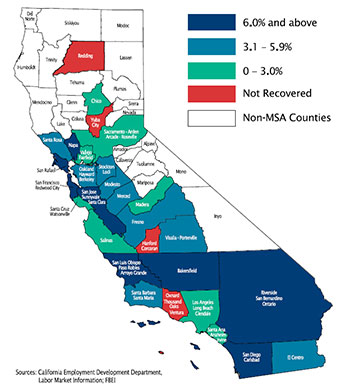
Figure 1: Eight Metro Areas Race Ahead
Percent Change in Jobs from Pre-Recession Peaks
An Impressive Report
California�s job market surged forward in April, featuring the largest employment advance since last July. The state�s nonfarm employers added nearly 60,000 jobs to their payrolls between March and April. Meanwhile, the state�s jobless rate declined from 5.4% to 5.3%. A year ago, and the jobless rate was 6.5%. The state�s unemployment rate is now just 0.3 percentage point above the national 5% average.
The number of the state�s 29 metropolitan areas that have fully recovered from their recession job lows remains at 25. (See Figure 1) The only four metropolitan statistical areas (MSA) that have not recovered are Hanford-Corcoran, Redding, Oxnard-Ventura-Thousand Oaks, and Yuba City. Eight of California�s areas have achieved increases of 6% or more relative to their prior peak levels of employment. The San Francisco metropolitan area has led with a nearly 18% advance, followed by Santa Clara County at 15%.
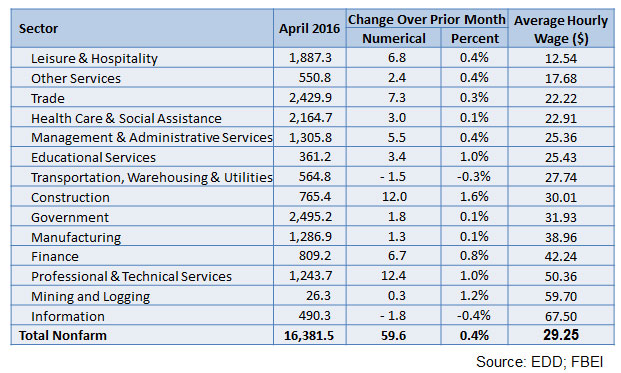
Job gains took place between March and April in nearly all sectors. (See Figure 2.) Professional and technical services, including such areas as scientific research, computer systems design, and advertising, recorded the largest numerical gain at 12,400 new jobs. Construction scored the largest percentage increase at 1.6%. Mining and logging even joined in on the job gains during the month. The only sectors losing jobs involved information, including publishing, and telecommunications, warehousing and utilities.
Figure 2: California Job Growth Widespread Among Sectors
April 2016, seasonally adjusted, thousands
Jobs and Wages
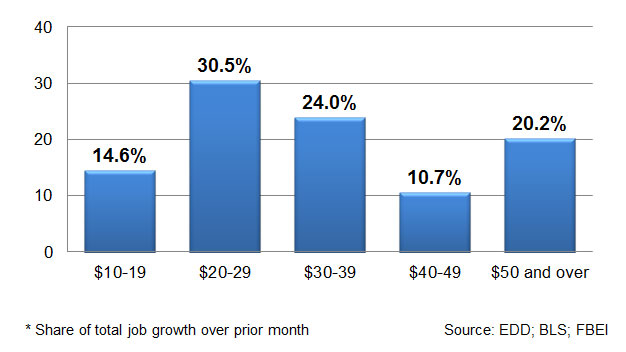
Of the 60,000 jobs created in April, how much did these people earn? Job openings took place across a wide range of wage and salary levels. (See Figure 3.) At about 30%, the largest percentage of new jobs occurred in the $20-29 per hour bracket. These jobs primarily encompassed trade, health care, administrative positions, and educational services. Fewer than 15% of the job gains took place in the lowest bracket of $10-19 an hour, with these jobs concentrated primarily in leisure, hospitality, and various personal care services. Slightly more than one-fifth of the new jobs created during the month took place in the highest income bracket, with the average wage running $50 an hour or more. These positions were highly concentrated in various professional and technical services, along with mining.
Figure 3: Job Growth Dispersed Across Hourly Wage Levels*
April 2016
California can always do better, but the state�s economy is creating large numbers of new jobs and many of those jobs are highly compensated.
Lynn Reaser is chair of the treasurer’s Council of Economic Advisors and chief economist at the Fermanian Business and Economic Institute for Point Loma Nazarene University. The opinions in this article are presented in the spirit of spurring discussion and reflect those of the author and not necessarily the treasurer, his office or the State of California.