Investment Division


Select any of the graphs below to view more detailed information or to print the graph in PDF format.
Pooled Money Investment Account
Market Value of PMIA Funds*
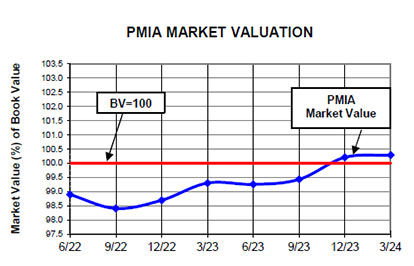
*as of dates indicated
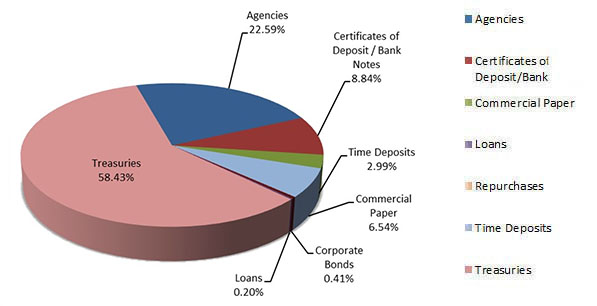
PMIA Portfolio Composition - 02/28/2025
Total: $156.8 Billion
(chart dollars in millions)
Time Deposit Program
Time Deposit Program Participation Information as of 02/28/2025
| Institution Size | # of Institutions | Total Deposits |
|---|---|---|
| Total Assets | % of TD Program | % of TD Program |
| < $5 billion | 62.3% | 31.9% |
| $5-10 billion | 18.9% | 29.5% |
| $10-20 billion | 9.4% | 13.8% |
| $20-50 billion | 7.5% | 19.7% |
| > $50 billion | 1.9% | 5.9% |
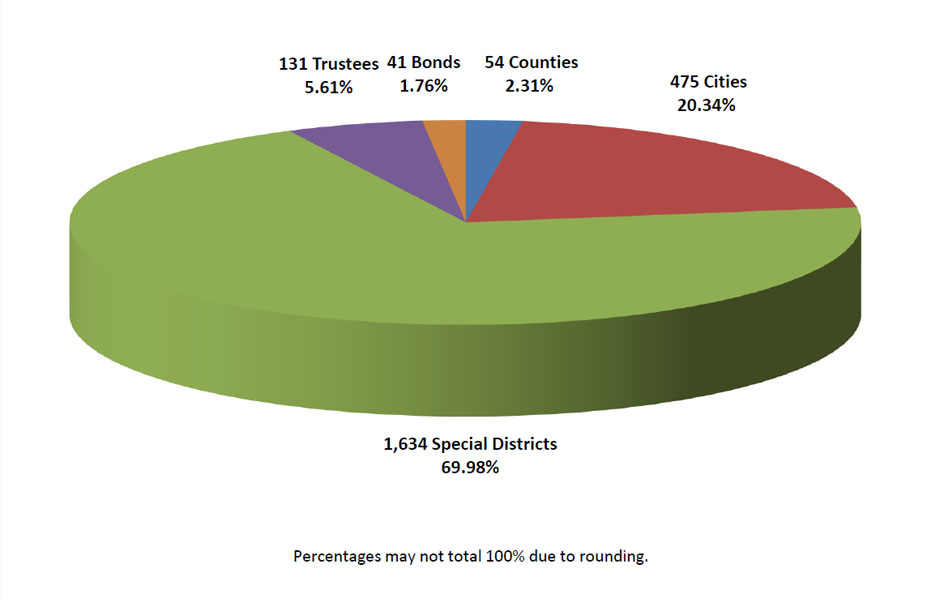
Local Agency Investment Fund
LOCAL AGENCY INVESTMENT FUND
Participation as 03/31/25
2,335 Agencies