Vol. 1, No. 6, Published October 1, 2015
Summary of Ratings and Borrowing Costs
Where Does California Fit In?

Despite improvements this year, California�s bond ratings still remain lower than all but two rated states: Illinois and New Jersey. And Pennsylvania�s ratings are only slightly better than those of the Golden State. (See a detailed comparison.)
However, for California, holding the higher rating levels over time is what matters most. Lower ratings provoke investors to demand higher yields, which translates into higher borrowing costs.
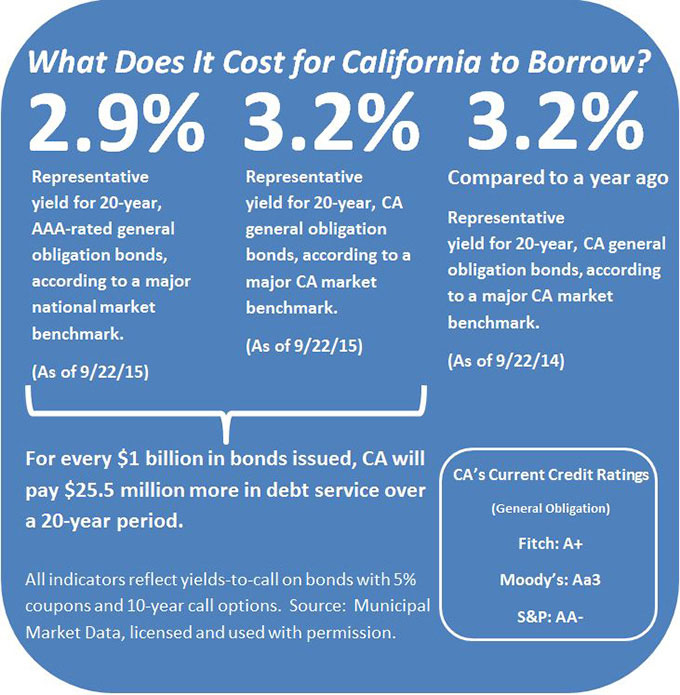
The State�s recent 20-year yield sat at 3.19 percent, higher than the 2.87 percent yield on a national benchmark of AAA-rated bonds, a difference of 0.32 percent. (See Figure 1.)
Compared to the prior month, the nominal yield on the California benchmark dropped by 0.07 percent, while the nominal yield on the national benchmark dipped slightly by 0.01 percent.
The difference between the two benchmarks one year earlier was slightly narrower: California’s yield was 3.22 percent, while that same national benchmark was at 2.91 percent, a difference of 0.31 percent.
The two benchmarks are essentially unchanged when comparing data from last year and this year. What does this mean? This is probably happenstance, though readers should note that: 1) interest rates remain historically low, and 2) until the Federal Reserve raises interest rates, the market will tend to fluctuate within a fairly narrow band, based primarily on supply and demand factors. See Figure 3 for a representation of just how narrow the band is at this time.
Figure 1: Borrowing Costs
What does this mean for California taxpayers?
In general, for every $1.0 billion in bonds issued, the State will incur higher borrowing costs as a result of investors demanding investment yields. The result in such a scenario would be about $25.5 million in higher debt service over a 20-year period compared to the national benchmark of AAA-rated, tax-exempt bonds. (See Figure 2.) This compares to higher debt service of $31.7 million illustrated in last month's edition.
After rising last month from $20.5 million to $31.7 million over a 20-year period for each $1.0 billion borrowed, this measure has fallen. This is a pattern that has been repeated often. Because the State issues debt in two predictable cycles each year, and when it does issue debt, it does so in large amounts (especially when refinancing), there is frequently an observable supply-and-demand imbalance. Greater supply equals higher yields. Those higher yields expand the comparative measure displayed in Figure 2. That is why refinancing decisions become so complex. It would be unwise to refrain from refinancing debt simply because there is an oversupply causing yields advantages to shrink. Similarly, it would also be unwise to refinance all debt at a moment in time. Using our best judgment, the State Treasurer’s Office seeks to accomplish taxpayer savings through a variety of means, including dollar-cost averaging to blunt the effects of these supply-and-demand imbalances.
Figure 2: Comparing California's Borrowing Costs to a National Benchmark
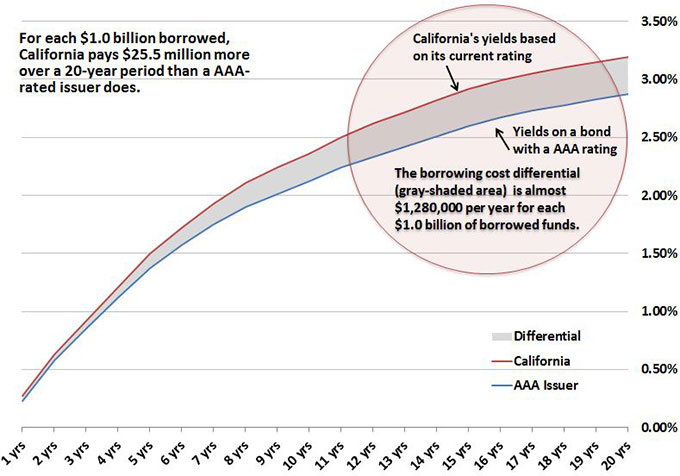
Source: Municipal Market Data as of 9/22/15
When it comes to understanding why investment yields and borrowing costs behave this way, it helps to look at long-term trends.
Figure 3, below, shows the one-year trend in another widely used index, the Bond Buyer 20-Bond Index, over the past year. California�s most recent offerings are shown as vertical bars.
The grey band in Figure 3 represents the normal variance around a long-term trend, which can be thought of as the center of the grey band. The blue line represents the changes in the trend over time.
Figure 3: One-Year Trend of Interest Rates, Selected California Borrowings Shown as Vertical Bars
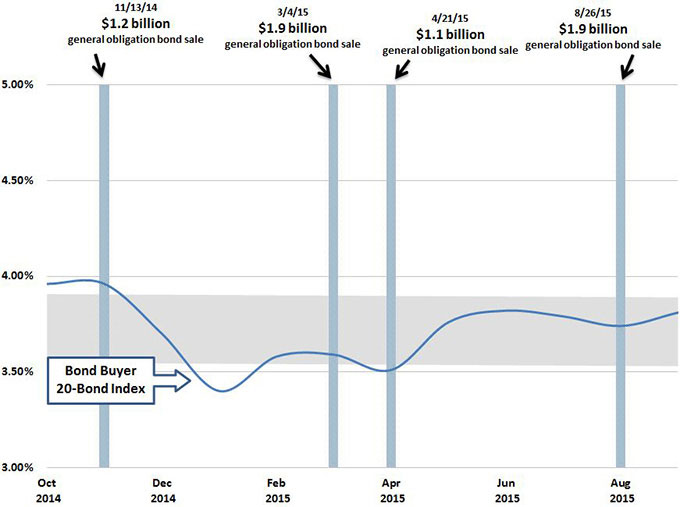
Source: The Bond Buyer
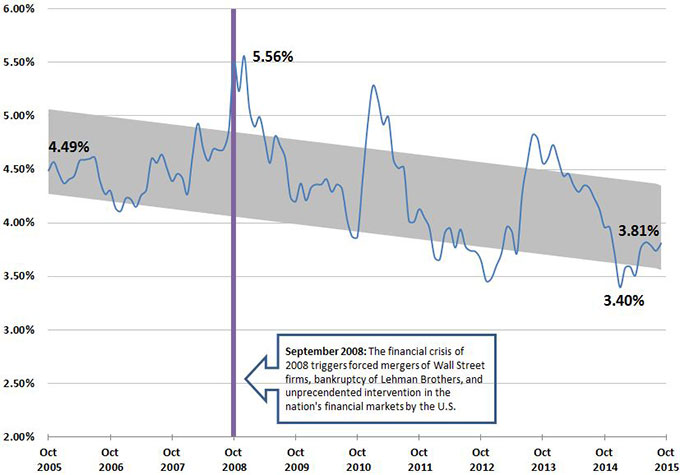
Interest rates on State and local government bonds are lower than they were a decade ago. Figure 4 also uses the Bond Buyer 20-Bond Index, but over a longer 10-year period.
Despite the fluctuation of rates over this longer period, it�s important to remember that this index is still more than one-half percent lower than it was 10 years ago. Borrowing at today�s rates is, by comparison, a bargain versus borrowing 10 years ago.
Note that California was fortunate to be at the bottom of (or even below) the band last spring. Most recently, the State sold its debt nearer to the top of the band. Nevertheless, the objective should be to stay within the band whenever possible.
Figure 4: 10-Year Trend of Interest Rates on State and Local Government Bonds
Source: The Bond Buyer