
Vol. 1, No. 7, Published November 4, 2015
Summary of Ratings and Borrowing Costs
Where Does California Fit In?

California received two upgrades this year, but the Golden State’s ratings still remain lower than all but two rated states: Illinois and New Jersey. And Pennsylvania’s ratings remain only slightly better than those of the Golden State. (See a detailed comparison.)
However, for California, holding the higher rating levels over time is what matters most. Lower ratings provoke investors to demand higher yields, which translates into higher borrowing costs.
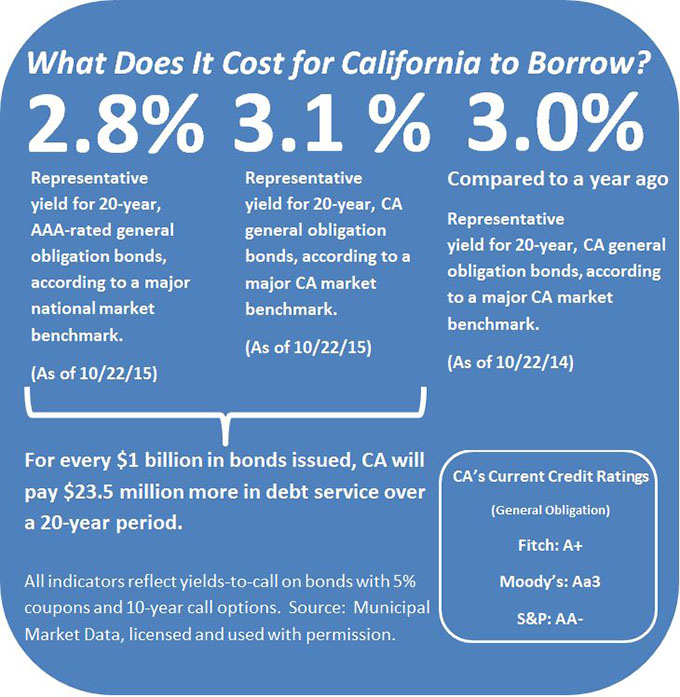
The State’s recent 20-year yield sat at 3.1 percent, higher than the 2.8 percent yield on a national benchmark of AAA-rated bonds, a difference of 0.30 percent. (See Figure 1.)
Compared to the prior month, the nominal yield on the California benchmark fell by 0.09 percent, while the nominal yield on the national benchmark dipped by 0.07 percent.
The difference between the two benchmarks one year earlier was slightly wider: California’s yield was 3.0 percent, while that same national benchmark was at 2.65 percent, a difference of 0.35 percent.
How should the benchmarks be explained? The slightly narrower margin of difference (i.e., 0.30 percent vs. 0.35 percent a year ago) may be a function of market noise as well as perceptions that California's credits strengths justify tighter spreads.
Figure 1: Borrowing Costs
What does this mean for California taxpayers?
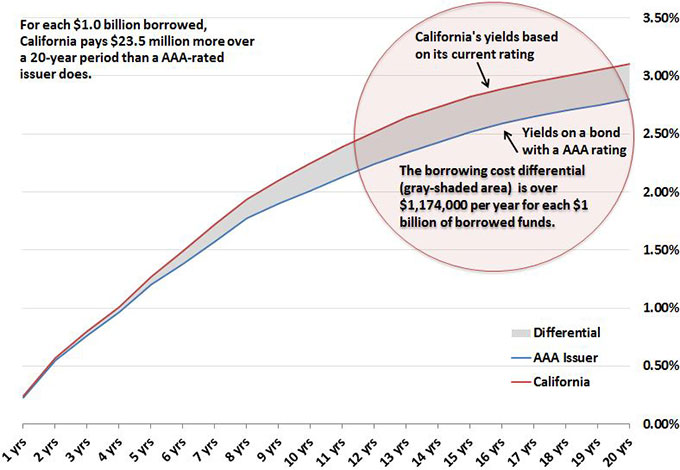
In general, for every $1.0 billion in bonds issued, the State will incur higher borrowing costs as a result of investors demanding higher investment yields. The result in such a scenario would be about $23.5 million in higher debt service over a 20-year period compared to the national benchmark of AAA-rated, tax-exempt bonds. (See Figure 2.) This compares to higher debt service of $25.5 million illustrated in last month's edition, while before that the cost sat at $31.7 million.
Some financial market observers would attribute this decline as positive news indicative of growing investor confidence in California. While that may be true, caution should be used before concluding this is a trend.
Observe that the band is quite narrow in the early years and grows over time. This reflects market uncertainty, among other things.
Figure 2: Comparing California's Borrowing Costs to a National Benchmark
Source: Municipal Market Data as of 10/22/15
When it comes to understanding why investment yields and borrowing costs behave this way, it helps to look at long-term trends.
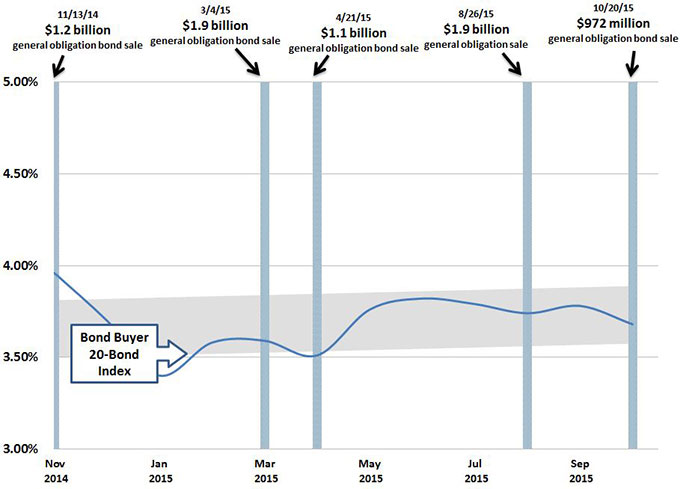
Figure 3, below, shows the one-year trend in another widely used index, the Bond Buyer 20-Bond Index, over the past year. California�s most recent offerings are shown as vertical bars.
The grey band in Figure 3 represents the normal variance around a long-term trend, which can be thought of as the center of the grey band. The blue line represents the changes in the trend over time.
Figure 3: One-Year Trend of Interest Rates, Selected California Borrowings Shown as Vertical Bars
Source: The Bond Buyer
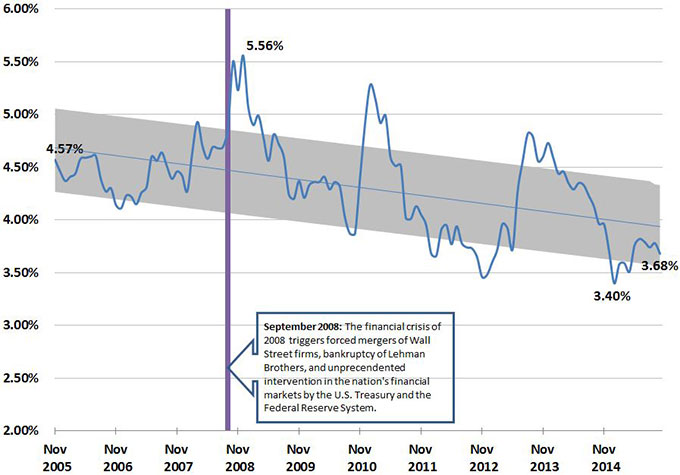
Interest rates on State and local government bonds are lower than they were a decade ago. Figure 4 also uses the Bond Buyer 20-Bond Index, but over a longer 10-year period.
Despite the fluctuation of rates over this longer period, it’s important to remember that this index is three-quarters of one percent lower than it was 10 years ago. Borrowing at today’s rates is, by comparison, still a bargain versus borrowing 10 years ago.
When my office sells the State�s bonds, the objective is not to speculate on interest rates. Rather, the objective is to ensure that California receives interest rates that are reflective of the market as a whole. Though the measurement of those results is an imprecise exercise, the comparison to the band indicates where California�s rates fit into the overall market.
Figure 4: 10-Year Trend of Interest Rates on State and Local Government Bonds
Source: The Bond Buyer